
Key Takeaways :
- Bitcoin has slipped below the psychologically and structurically important $110,000 level, testing support zones and liquidity areas.
- RSI is showing hints of bullish divergence, which some analysts interpret as an early signal of potential trend reversal.
- On-chain data reveals accumulation among mid-size holders (1–1,000 BTC) and a slowdown in selling by whales, indicating possible rebuilding of conviction.
- But headwinds remain: long-term holders continue to take profits, and multiple bearish divergences across timeframes warn of near-term weakness.
- The balance between technicals, market sentiment, and macro conditions (e.g., rate cuts, institutional flows) will determine whether Bitcoin reclaims $110K or slides lower.
1. Bitcoin under pressure at the $110,000 mark
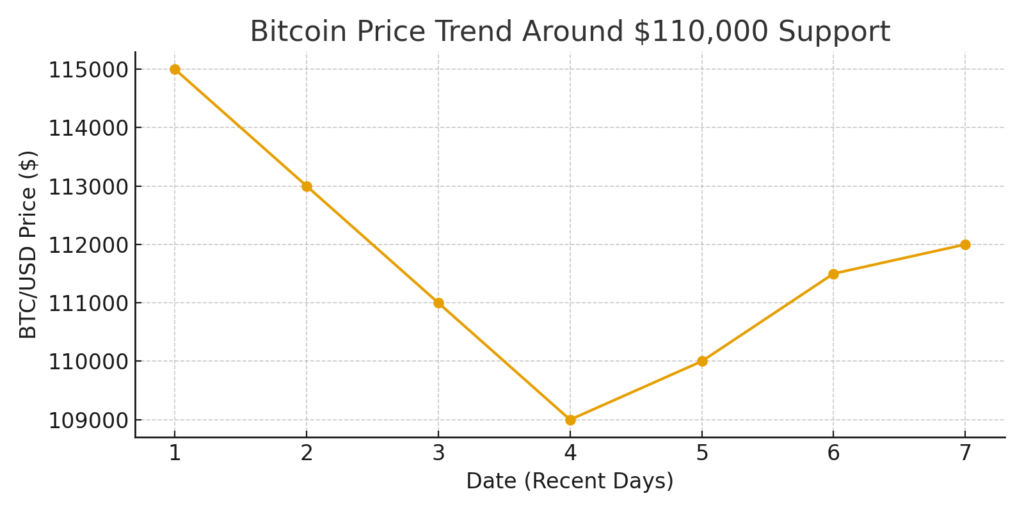
Bitcoin (BTC) has recently slipped below the key $110,000 support level, stirring debate about whether the move is a temporary dip or the start of a deeper correction. Market commentary highlights that liquidity zones and order book clusters lie immediately above and below current levels, making $112,300 a critical resistance and local lows a stress point for bulls.
Traders have been repeatedly testing this “demand band” (some argue this is the fourth time), with participants watching for a “lock-in” of support. Some analysts warn that a sustained break below could open the door to retesting $105,000 or even psychological zones like $100,000.
At the same time, technical indicators are sending mixed signals — while RSI hints at bullish divergence (discussed below), bearish divergences elsewhere raise caution flags.
2. RSI’s potential bullish divergence: early signal or trap?
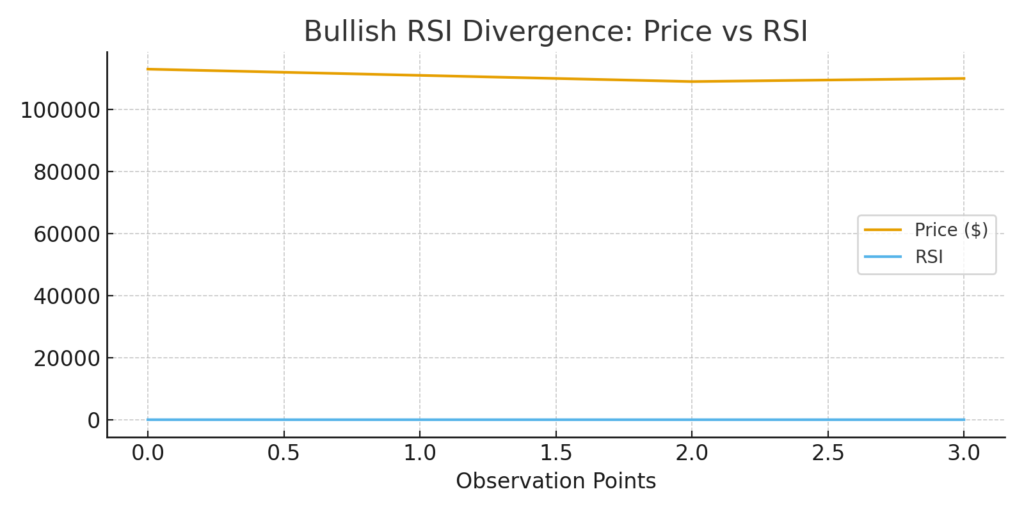
One of the more optimistic threads in the current narrative is the appearance of a bullish divergence in the Relative Strength Index (RSI) when contrasted with Bitcoin’s price movement. Under a classic divergence, the price makes a new low, but the RSI does not follow — instead, it forms a higher low, suggesting that downward momentum is weakening.
Analyst “Rekt Capital” argues that if Bitcoin closes above certain levels on a daily candle, it may more clearly shift into an upward mode. Others underscore that such divergences must be treated cautiously — not every divergence leads to a reversal.
In sum, RSI signals are worth watching, but they should not alone drive conviction — confirmation, volume, and supporting indicators will matter.
3. On-chain data: accumulation by mid-sized holders, reduced whale selling
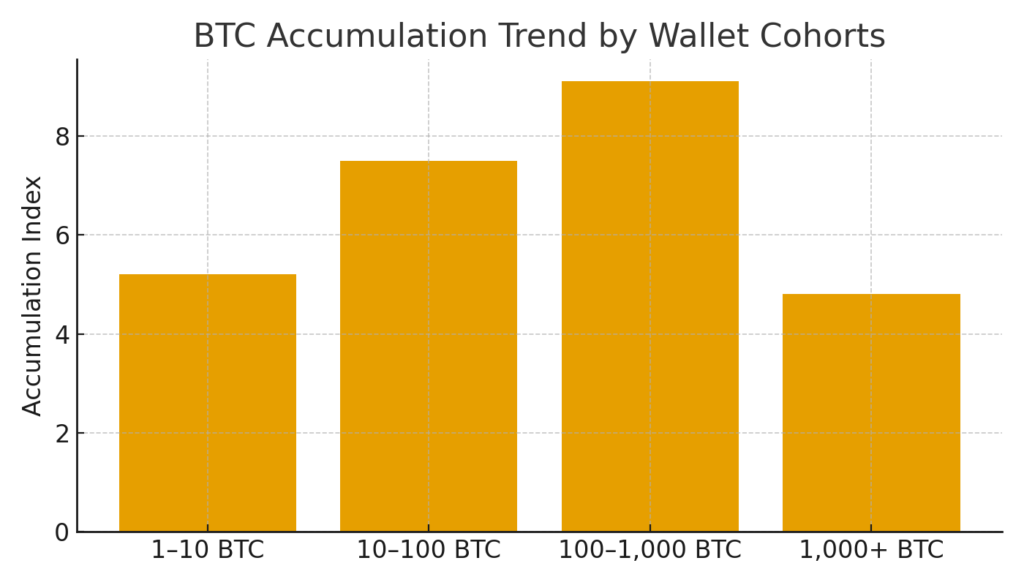
Beyond charts, blockchain-level data offers insight into how different cohorts are behaving:
- Addresses holding 1 to 1,000 BTC are showing “strong accumulation behavior,” suggesting that mid-sized investors see recent levels as attractive entry points.
- Whales and large holders, who had previously been offloading, have decelerated their selling activity.
- Recent on-chain flows reveal that over 1,465 BTC (approx. $162 million) were withdrawn from exchanges (Binance and FalconX), presumably moving into custodial or cold storage.
- These flows are often interpreted as reduced selling intent and strategic accumulation, rather than speculative short-term plays.
This mix — accumulation by significant but not ultra-large holders, and a flattening out of supply pressure from whales — is often viewed as a subtle signal that the market is gradually rebuilding a bid under current levels.
4. The profit-taking drag and divergence warnings
While accumulation is taking place, not all forces support a near-term rally. Key headwinds include:
- Long-term holders (LTHs) have been disposing of BTC aggressively. Since June, more than 300,000 BTC have been sold, with over 100,000 offloaded just in recent days.
- This suggests that those who accumulated early in this cycle are now crystallizing gains, adding latent downward pressure.
- Additionally, across multiple timeframes (15-min, 1-hr, 4-hr), technical analysts have flagged bearish divergences wherein prices are rising but momentum indicators, like RSI, are not confirming strength.
- The confluence of these warning signs suggests that even if Bitcoin does reclaim $110K, it may encounter stiff resistance or risk of a false breakout.
5. Macro and institutional flows: the bigger external levers
Bitcoin’s path cannot be interpreted in isolation; macro dynamics and institutional flows remain crucial:
- According to reports, public companies currently hold ~1.02 million BTC, representing $117 billion in value — a figure that rose ~28% in Q3 2025.
- Institutional confidence continues: 48 new firms added BTC in Q3, and large players like Strategy hold ~640,000 BTC.
- The CME FedWatch tool shows a ~96.7% probability of a 25 bps rate cut, which could boost liquidity and spur risk asset inflows.
- On the flip side, seasonal patterns and profit-taking behavior suggest that Q4 often sees consolidation or pullbacks, even in bullish cycles. Analysts caution that the familiar four-year cycle narrative may be under strain, especially if momentum weakens.
- External shocks (e.g., macro risk, regulatory changes, geopolitical events) could easily blow off momentum if sentiment sours.
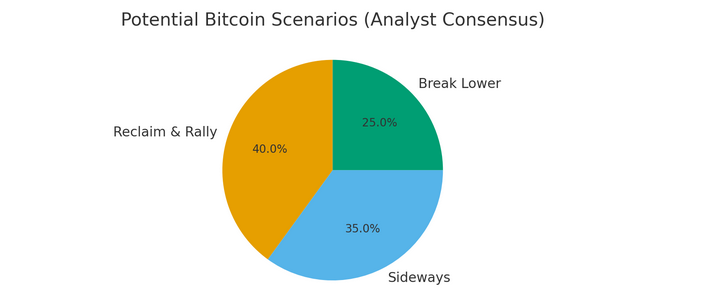
6. Scenario outlooks and ranges to watch
Given the mixture of signals, several plausible scenarios emerge:
| Scenario | Price Path | Key Triggers / Risks | What to Watch |
|---|---|---|---|
| Reclaim & rally | BTC moves back above $110K, retests $112K–$113K resistance, potentially pushes toward new highs | Confirmation of RSI divergence, strong volume, institutional bids | Liquidity sweeps, derivatives positioning, macro tailwinds |
| Sideways consolidation | BTC trades in a chop range between $108K and $115K | Mixed signals hold, accumulation vs. distribution balance | Break of range, catalyst events |
| Break lower | BTC slips below $108K, possibly targeting $105K or $100K zones | Bearish divergences play out, LTH supply pressure intensifies | Support zones, capitulation signals, macro stress |
To materially challenge a downtrend, bulls would need not just a reclaim of $110K, but sustained strength through $112–113K with volume backing. Without that, pullbacks remain a significant risk.
7. Practical implications for crypto seekers and builders
For your audience—people seeking new crypto opportunities or real-world applications of blockchain—here are some tactical takeaways:
- Edge timing exposure: If entering or scaling into Bitcoin, doing so in manageable increments near support (e.g., $105K–$110K) may reduce downside risk. Avoid all-in bets until confirmation emerges.
- Monitor cohort behavior: Whale and mid-tier accumulation flows often presage shifts in trend. Tools aggregating on-chain flows and wallet movements may offer early alerts.
- Diversify across use cases: Given inherent volatility in BTC, consider exposure to layer-1s, L2s, or real-world projects (e.g. DeFi, infrastructure) that have stronger utility backings.
- Stay alert to catalysts: Macro indicators (rate cuts, inflation data), regulatory developments, ETF flows, and derivatives positioning can strongly sway crypto markets.
- Use confirmation before conviction: Even if RSI divergence looks promising, wait for price confirmation (breakouts, retests, volume) before expanding positions.
Conclusion
Bitcoin’s slip beneath $110,000 has stoked renewed tension in the market. On one side, RSI divergence and accumulation by mid-size holders hint at a subtle rebuilding of buyer conviction. On the other side, profit-taking from long-term holders and bearish divergences across shorter timeframes caution against complacency.
Ultimately, the next directional move will likely depend on whether bulls can force a clean reclaim of $110–113K or whether sellers reassert control, pushing BTC deeper. For those scouting crypto opportunities, this moment is less about certainty and more about positioning wisely, watching flows, and waiting for confirmation before leaning heavily in.
