
Main Points :
- $68,300 is the decisive weekly level — a close below this zone risks turning the 200-week EMA into firm resistance.
- Historical precedent warns of “bearish acceleration” if Bitcoin fails to reclaim the 200-week trendline.
- Mayer Multiple signals deep undervaluation, historically associated with high long-term returns.
- Institutional accumulation patterns suggest structural demand, even amid short-term volatility.
- For long-term investors and builders, current conditions resemble prior accumulation phases.
1. The $68,300 Battlefield: 200-Week EMA as the Deciding Line
Bitcoin is once again testing one of the most important long-term technical indicators in its history: the 200-week exponential moving average (200W EMA). Recent price action has hovered around $67,000 for consecutive sessions, but analysts warn that the true inflection point lies slightly higher — at approximately $68,300.
Historically, the 200-week EMA has functioned as Bitcoin’s ultimate macro support. During previous bear markets, price retracements into this zone marked generational accumulation opportunities. However, once broken on a weekly closing basis, the same level has tended to flip into resistance — often triggering further downside acceleration.
Technical analyst Rekt Capital has emphasized that a weekly close below $68,300 followed by a failed retest could replicate previous bear-cycle structures. In earlier cycles, once Bitcoin closed below the 200W EMA and subsequently rejected it on a bounce, price declines intensified over the following months.
The implication is not merely technical — it is psychological. The 200-week EMA represents the average long-term cost basis of market participants. Losing it signals broad underwater positioning, which can amplify volatility as leveraged participants unwind positions.
For investors seeking the next high-upside opportunity, understanding this level is critical. A weekly reclaim could signal structural strength. A confirmed rejection could create deeper discounts — potentially forming a stronger long-term base.
2. The “Cloud” of Support: 200-Week EMA and SMA Interaction
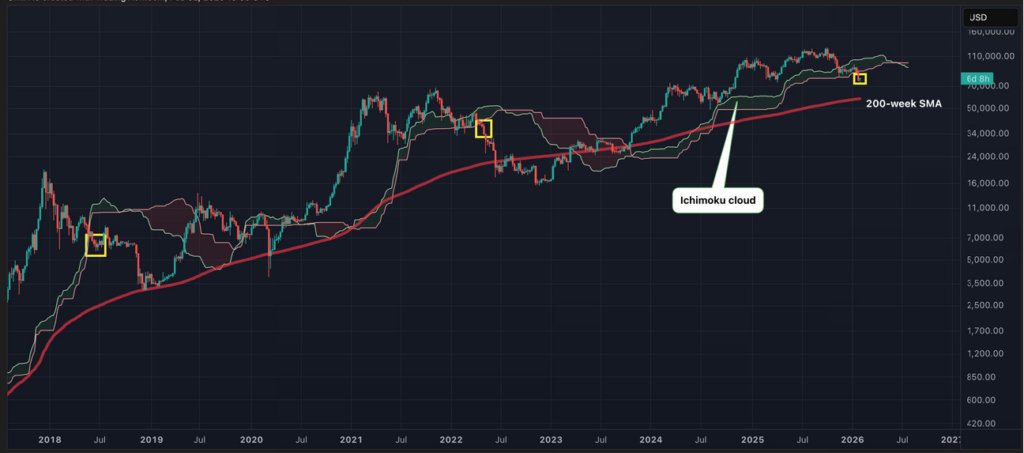
Beyond the EMA, Bitcoin is also interacting with the 200-week simple moving average (200W SMA). Together, these two lines form what traders often describe as a “support cloud.”
During past cycles — notably 2015, 2018–2019, and 2022 — price consolidation within this cloud preceded major long-term recoveries. The current structure shows Bitcoin attempting to hold above the 200W SMA while repeatedly testing the EMA boundary.
This compression between trendlines typically precedes a significant directional move. The market is essentially deciding whether the current cycle resembles:
- A mid-cycle correction within a broader bull trend, or
- The beginning of a prolonged distribution phase.
For professional allocators and digital asset funds, this zone becomes a risk-management pivot. Accumulation strategies often scale entries across the 200W moving average region rather than attempting to catch an exact bottom.
3. Mayer Multiple: A Rare Undervaluation Signal
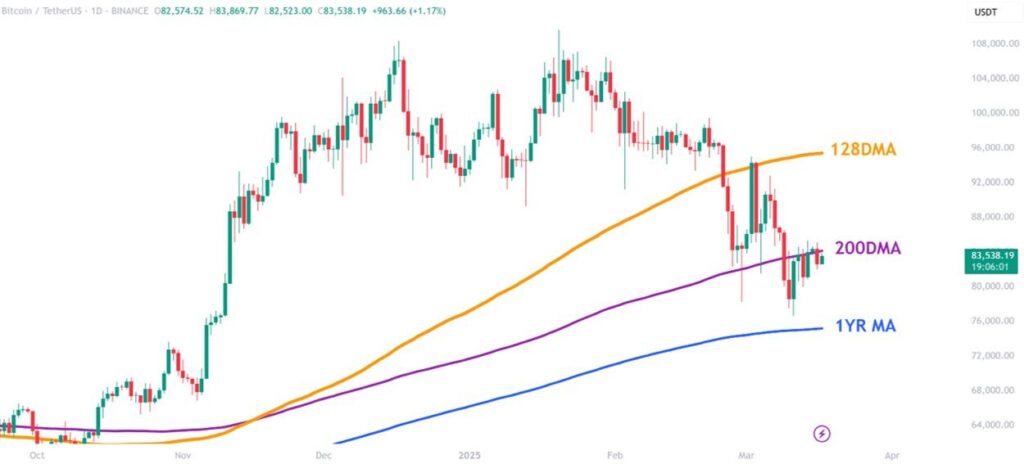
While price action appears uncertain, valuation metrics tell a different story.
The Mayer Multiple — defined as the ratio between Bitcoin’s current price and its 200-day moving average — is currently at levels seen during only approximately 5% of Bitcoin’s historical lifetime.
Traditionally:
- Below 0.8 → long-term high-return accumulation zone
- Above 2.4 → historically overheated conditions
Recent readings have approached 0.6, a level rarely observed outside deep bear markets.
Quantitative fund manager Charles Edwards has noted that although further downside is always possible, such readings historically rank among the strongest long-term buy signals. The last time the Mayer Multiple reached comparable levels was during the 2022 bear market capitulation phase.
This divergence — fragile technical structure but deeply compressed valuation — is precisely the environment that long-term investors monitor carefully.
4. Market Context: Institutional Flows and Macro Environment
Beyond chart indicators, broader macro trends influence Bitcoin’s trajectory.
Recent developments across global markets show:
- Continued institutional integration of Bitcoin ETFs.
- Ongoing geopolitical uncertainty increasing demand for non-sovereign stores of value.
- Liquidity cycles influenced by Federal Reserve rate expectations.
- Growing use of Bitcoin as collateral in structured lending and treasury strategies.
For builders in the blockchain space, this matters. When valuation metrics compress while infrastructure expands, asymmetric opportunities often emerge — not only in Bitcoin itself but across:
- Layer 2 ecosystems
- Decentralized finance protocols
- Tokenized real-world asset platforms
- Mining infrastructure and energy arbitrage models
Historically, periods when Bitcoin trades near its long-term moving averages coincide with quiet accumulation by sophisticated capital.
5. Risk Scenario: Bearish Acceleration
If Bitcoin fails to close above $68,300 on a weekly basis and subsequently rejects that level, several consequences could unfold:
- Momentum traders may increase short exposure.
- Leveraged long positions could unwind.
- Sentiment could shift toward defensive positioning.
Such a move would not necessarily invalidate the long-term thesis — but it could extend consolidation or correction into deeper levels, potentially toward prior structural supports.
For strategic investors, this would represent an opportunity to deploy capital in tranches rather than a reason to exit entirely.
6. Opportunity Framework for Investors Seeking Yield and Innovation
For readers focused on new crypto assets and revenue streams, current conditions suggest several strategic angles:
A. Structured Accumulation
Scaling Bitcoin exposure through dollar-cost averaging near long-term moving averages.
B. Volatility Harvesting
Using options strategies or delta-neutral yield models during compression phases.
C. Infrastructure Allocation
Investing in exchanges, custody, compliance tooling, or tokenization frameworks that benefit regardless of short-term price swings.
D. Undervalued Layer 1 and Layer 2 Ecosystems
Historically, when Bitcoin compresses near macro support, capital rotation into emerging ecosystems begins quietly.
7. Long-Term Perspective: Cycles Repeat, but Structures Strengthen
Bitcoin has repeatedly demonstrated cyclical behavior:
- 2015: 200W MA accumulation before exponential rally
- 2019: retest before expansion
- 2022: deep undervaluation and institutional base formation
Each cycle leaves the network stronger — with higher hash rate, deeper liquidity, and broader regulatory clarity.
Today’s structure mirrors prior accumulation regimes more closely than distribution tops. The Mayer Multiple supports this thesis, even if short-term volatility persists.
Conclusion
Bitcoin stands at a structural decision point.
A weekly close above $68,300 could reinforce the 200-week EMA as support and reestablish bullish momentum. A confirmed rejection, however, risks triggering a phase of bearish acceleration consistent with historical precedent.
Yet valuation metrics such as the Mayer Multiple indicate that Bitcoin is already trading in a zone historically associated with long-term accumulation and outsized returns.
For investors searching for new crypto opportunities, the lesson is clear:
Short-term uncertainty often creates long-term asymmetry.
Whether Bitcoin breaks higher or dips further, the current compression phase resembles previous generational entry zones. Strategic capital deployment — rather than emotional reaction — will define who benefits from the next structural expansion of the digital asset market.
