Main Points :
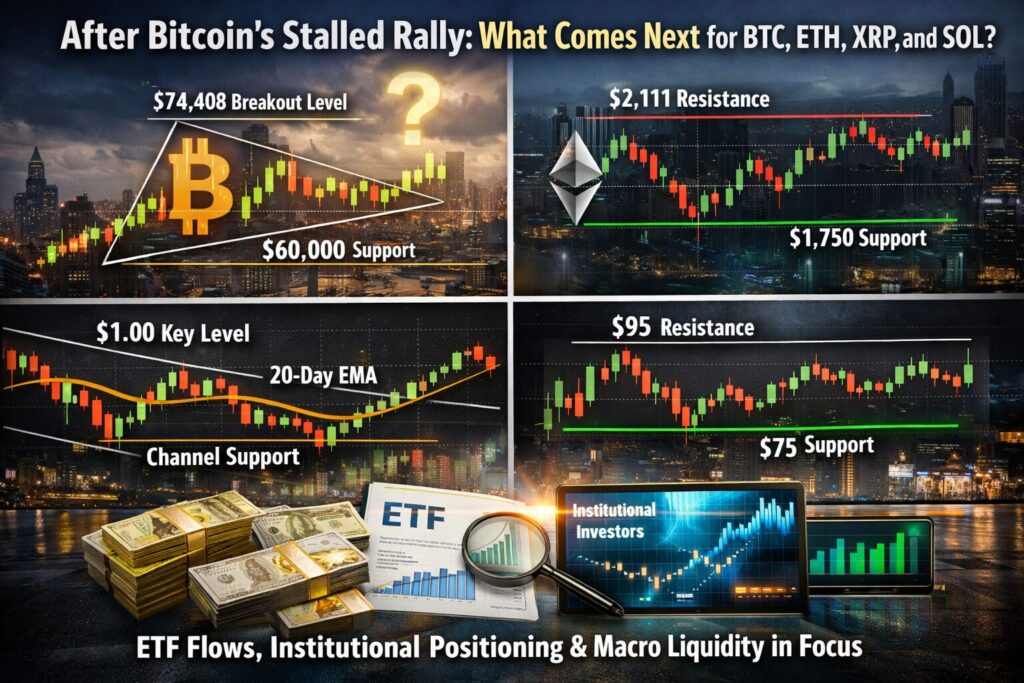
- Bitcoin is compressing inside a symmetrical triangle, with $60,000 and $52,500 as major downside risk levels, and $74,408 as the key bullish confirmation level.
- Ethereum remains trapped between $1,750 and $2,111, awaiting breakout confirmation for the next directional move.
- XRP is hovering between descending channel support and its 20-day EMA, with $1.00 becoming a psychological battleground if support fails.
- Solana shows structural resilience but faces strong resistance near $95 while $75 remains critical support.
- Broader market context: ETF flows, institutional positioning, on-chain metrics, and macro liquidity conditions will shape the next phase.
Bitcoin (BTC): Compression Before Expansion
Bitcoin’s recent relief rally stalled at the 20-day exponential moving average around $68,895, signaling that bearish sentiment still lingers beneath the surface. Rather than breaking decisively higher, BTC has formed a symmetrical triangle pattern — a formation typically interpreted as a continuation structure.
[BTC Chart]
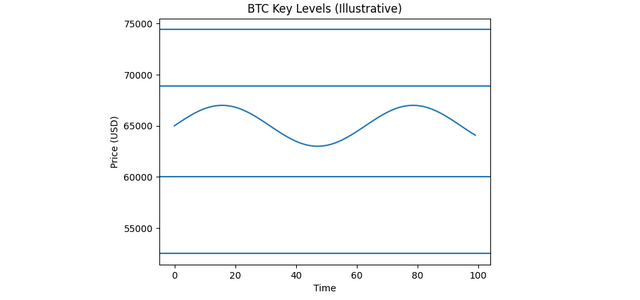
Within this formation, volatility compresses while both buyers and sellers reduce conviction. Historically, such compression phases precede significant expansion moves. The key technical inflection points are clear:
- Downside break below triangle support → Risk toward $60,000
- Failure of $60,000 → Acceleration toward $52,500
- Upside close above resistance line → Potential rally to $74,408
- Close above $74,408 → Strong evidence that $60,000 formed a structural bottom
For investors seeking asymmetric opportunity, triangles offer defined risk structures. A downside break may trigger forced liquidations in leveraged derivatives markets. On the other hand, a confirmed breakout above $74,408 could attract ETF inflows and algorithmic trend-following capital.
Recent market developments add context. Spot Bitcoin ETFs in the United States continue to influence liquidity flows. Periods of net inflow have historically coincided with technical breakouts. Meanwhile, on-chain data shows that long-term holders are not aggressively distributing, suggesting underlying conviction remains intact.
If global liquidity conditions improve — particularly if the U.S. Federal Reserve signals rate stability or easing — Bitcoin could regain macro tailwind status as a digital reserve hedge.
Ethereum (ETH): Range Before Rotation?
Ethereum briefly broke above $2,111 but failed to sustain the breakout. The rejection confirms that sellers remain active at that level. ETH is now oscillating between $1,750 and $2,111.
[ETH Chart]
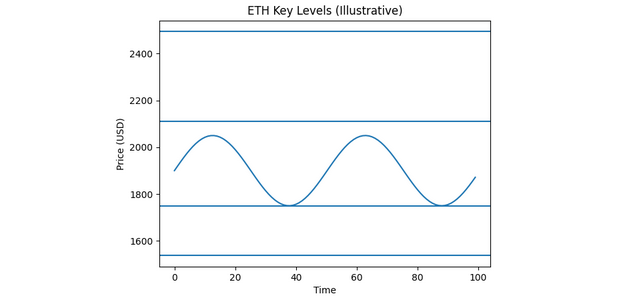
This range structure implies equilibrium. Neither bulls nor bears hold dominance. The next decisive move depends on which boundary breaks:
- Breakdown below $1,750 → Next support near $1,537
- Close above $2,111 → Potential move toward 50-day SMA at $2,494
Ethereum’s structural thesis differs from Bitcoin’s. ETH is not just a store-of-value narrative; it represents programmable capital infrastructure. Layer-2 rollups, restaking protocols, and liquid staking derivatives continue expanding ecosystem utility.
Recent developments in Ethereum ETFs and institutional staking products are particularly relevant. If staking yields become accessible within regulated products, Ethereum could attract income-oriented capital — transforming it from a pure growth asset into a hybrid yield + growth instrument.
For blockchain builders and investors, Ethereum remains the dominant settlement layer for DeFi, NFTs (despite reduced volumes), tokenized RWAs (real-world assets), and emerging restaking frameworks.
A breakout above $2,111 would likely coincide with increased DeFi TVL and restaking growth. A breakdown, however, may temporarily shift capital rotation toward alternative L1s.
XRP: Structural Tension Within a Descending Channel
XRP is currently trading between its 20-day EMA at $1.44 and the support line of a descending channel.
[XRP Chart]
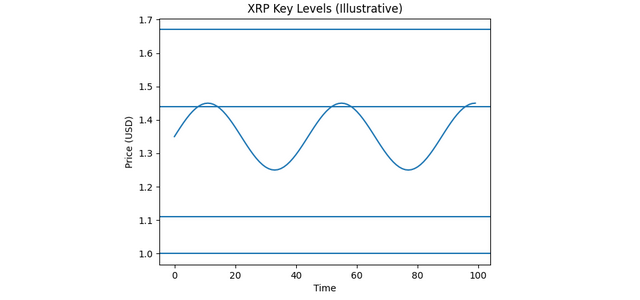
This positioning reflects structural tension. Bears aim for a breakdown below the channel support, while bulls defend aggressively.
Key scenarios:
- Strong rebound from support → Attempt to reclaim $1.44
- Break above $1.44 → Move toward 50-day SMA at $1.67
- Failure of support → Risk toward $1.11
- Breakdown below $1.11 → Psychological $1.00 test
XRP’s narrative is increasingly shaped by regulatory clarity. The outcome of legal proceedings in the United States significantly impacts institutional participation. Should regulatory certainty strengthen, XRP could re-enter cross-border settlement discussions among financial institutions.
From a practical blockchain use-case perspective, XRP’s core thesis lies in liquidity bridging. In a world moving toward tokenized cross-border finance, low-latency settlement rails remain strategically relevant.
For yield-seeking investors, XRP currently offers less native yield opportunity compared to ETH or SOL ecosystems. However, regulatory breakthrough could produce rapid repricing.
Solana (SOL): Resilience With Volatility
Solana reclaimed its 20-day EMA at $86 but met strong resistance near $95. Sellers pushed it back below the EMA, opening room toward $75 support.
[SOL Chart]
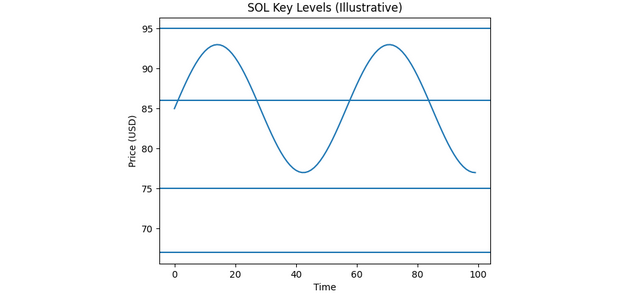
Critical levels:
- Bounce from $75 → Range between $75 and $95
- Close below $75 → Risk toward $67
Solana’s ecosystem has demonstrated resilience despite prior network outages. It continues to attract high-throughput applications, meme coin liquidity waves, and consumer-facing blockchain experiments.
Recent trends include:
- Increased DePIN (Decentralized Physical Infrastructure) deployments
- Growth in on-chain trading volumes
- Rising stablecoin activity
Solana often behaves as a high-beta Ethereum alternative. In risk-on environments, SOL tends to outperform BTC and ETH percentage-wise. However, it also declines faster during corrections.
For investors looking for ecosystem growth exposure, SOL remains one of the few L1s with sustained retail and developer engagement.
Macro Context: Liquidity, ETFs, and Risk Appetite
The crypto market no longer trades in isolation. Three macro variables dominate:
- U.S. interest rate trajectory
- ETF net flows
- Stablecoin supply expansion
Historically, crypto bull phases coincide with stablecoin supply growth — a proxy for deployable capital. If stablecoin market cap resumes expansion, it could provide fuel for altcoin rotations.
Bitcoin dominance levels also matter. If BTC breaks above $74,408, dominance may rise first. Later phases typically rotate toward ETH and then high-beta altcoins like SOL.
Institutional participation remains uneven. While Bitcoin ETFs gather assets, Ethereum products still lag. XRP and SOL ETFs remain speculative discussion topics.
Strategic Takeaways for Opportunity Seekers
For readers seeking new income streams and practical blockchain opportunities:
- BTC triangle breakout could define Q2 direction
- ETH range compression may precede staking yield narrative expansion
- XRP regulatory clarity could unlock cross-border use-case revaluation
- SOL remains a beta play on on-chain consumer activity
Each asset offers a different risk-reward profile:
- BTC = Macro hedge + ETF liquidity
- ETH = Programmable yield infrastructure
- XRP = Regulatory optionality
- SOL = High-growth ecosystem volatility
Portfolio construction should consider volatility scaling and capital rotation patterns rather than binary conviction.
Conclusion: A Market at an Inflection Point
Bitcoin’s stalled rally is not a sign of collapse — it is a sign of compression. Markets expand after compression. Whether that expansion breaks upward or downward will define the next cycle phase.
Ethereum awaits directional confirmation. XRP sits at regulatory crossroads. Solana balances growth with volatility.
For forward-looking investors, this is not a time for emotional reaction — it is a time for structural positioning.
The next decisive breakout — particularly in Bitcoin — will likely cascade across the entire market structure.
Prepared capital, not reactive capital, captures asymmetric opportunity.
