Main Points :
- A large wave of long-position liquidations across Bitcoin and major altcoins has sparked declines, with BTC falling below key resistance and ETH failing to hold critical support levels.
- XRP and Solana are under pressure: XRP broke below ~$3 support, while Solana has fallen toward its trendline support and $200s levels.
- Macro and policy drivers are contributing: expectations of Federal Reserve rate cuts, inflation concerns, and shifts in liquidity all play central roles.
- Technical charts and market structure show potential for further downside if key supports fail; conversely, strength above certain resistance zones could renew bullish momentum.
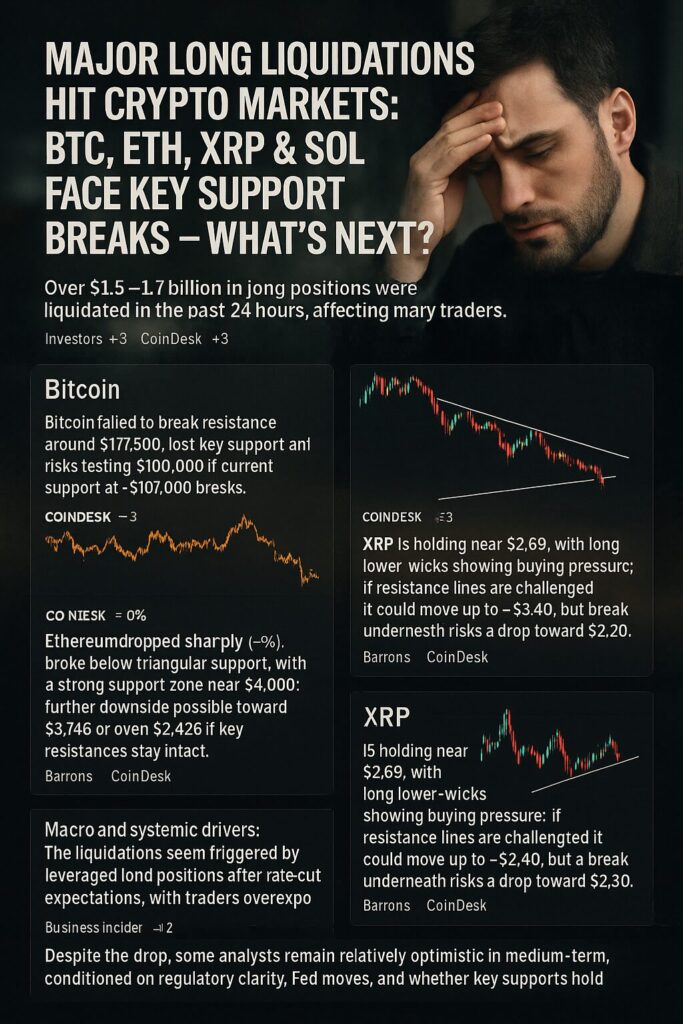
1. Bitcoin (BTC): Resistance Holds, Liquidations Hit
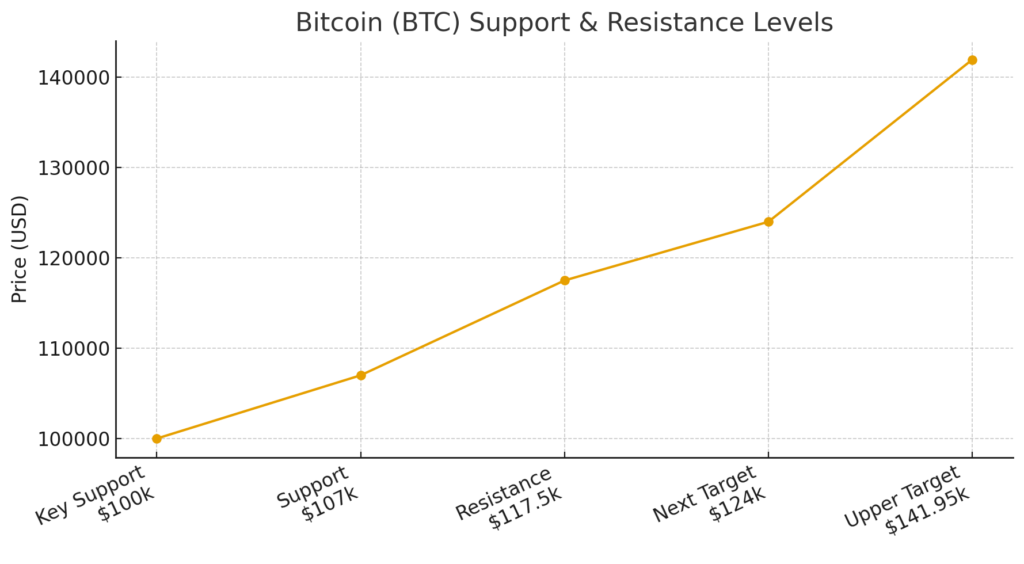
Bitcoin has recently failed to break above ~$117,500, triggering selling from short-term and leveraged holders. In the past 24 hours, over $1.6 billion in long positions were liquidated in the broader crypto market, the largest such event this year, with Bitcoin among the assets most affected.
Key support is around $107,000; if that gives way, BTC could slide further toward $100,000. On the upside, a clean break and daily close above ~$117,500 could open the path toward $124,000, with potential further gains up to ~$141,950 if momentum builds.
2. Ethereum (ETH): Weakness Below Resistance, Support Under Threat
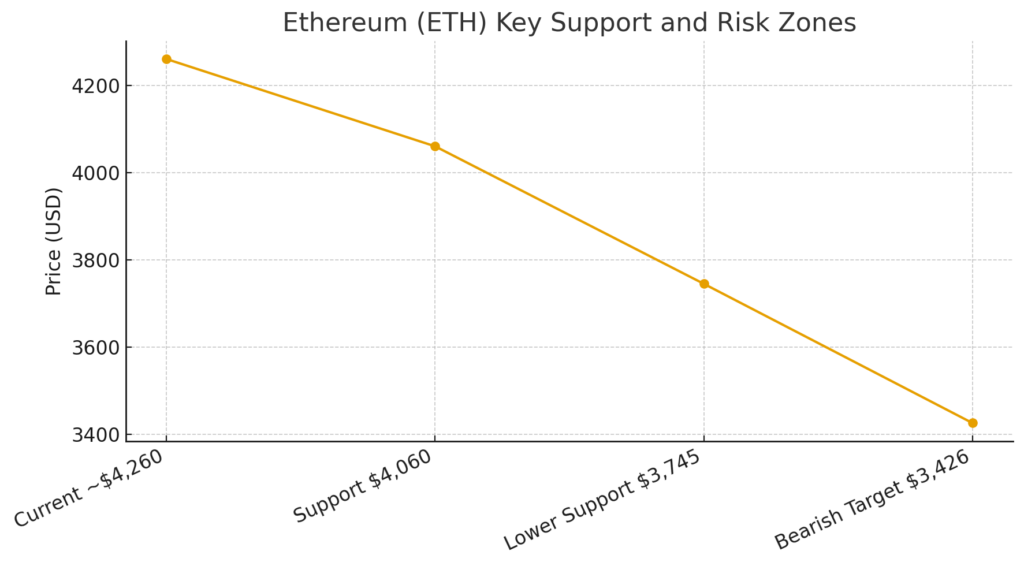
Ethereum has shown several failed attempts to rally past ~$4,700, which has turned into resistance. It has dropped to zones around $4,060 (from previous chart analyses) or more recently to the $4,100–$4,200 range during this recent downturn.
If ETH cannot defend support zones around $3,900-$4,100, there is risk of further drop toward $3,700 or lower until the $3,420 region (classic triangle breakdown targets) comes into view. On the positive side, any bounce would face resistance near ~$4,442 (20-day EMA) and then higher resistance zones.
3. XRP (Ripple): Key Support Broken, Downside and Upside Scenarios
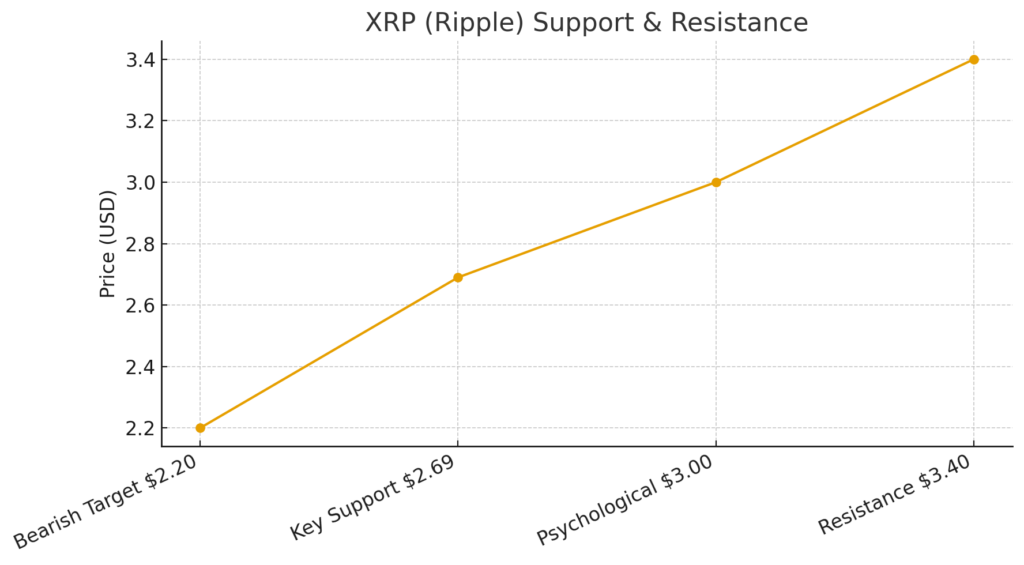
XRP has fallen below its key support (~$3), now trading under ~$2.90 more recently. The failure to hold above $3 exposes it to the risk of further declines.
If upward momentum returns, moving above the descending trendline could set a run toward ~$3.40. Conversely, a sustained close under key support could complete a bearish triangle and lead toward $2.20 or lower.
4. Solana (SOL): At Trendline Support, Critical Decision Ahead
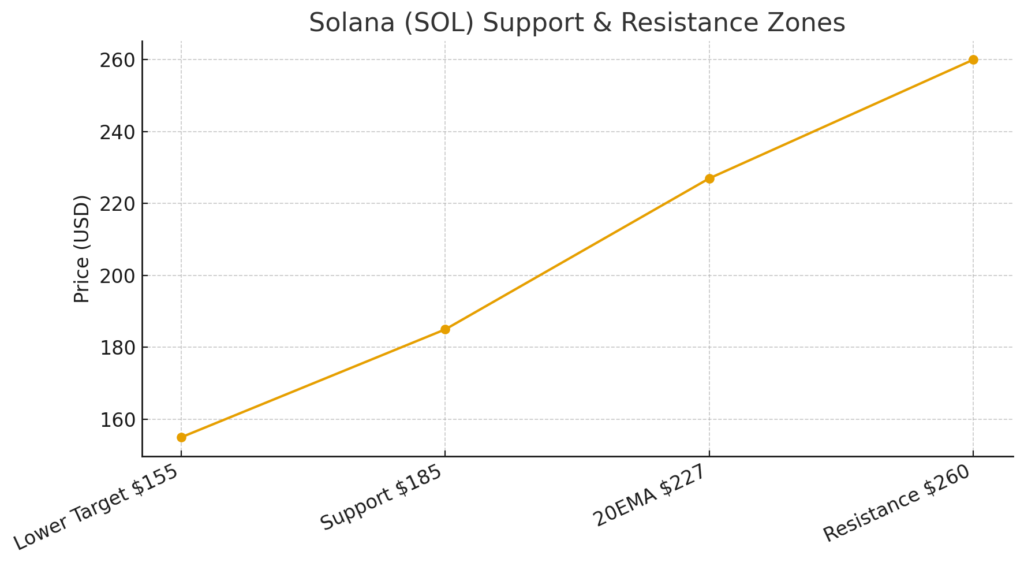
Solana has slipped below its 20-day EMA (~$227) and is approaching its rising trendline support. If this trendline holds, a bounce back toward $260 resistance is possible. However, failure of this support would likely lead to deeper losses toward $185, or even $155 if the breakdown is strong.
5. Macro Drivers & Market Sentiment
Several broader forces are influencing what’s happening in the charts:
- Rate expectations: The market broadly expects the U.S. Federal Reserve to cut rates, which has bolstered optimistic sentiment.
- Liquidations and leverage: Overhanging leverage has made the market fragile. A drop and surge in long-liquidations have exposed frailty in market structure.
- Inflation & economic data: Sticky inflation remains a concern, raising the risk that monetary policy won’t loosen as much or as fast as hoped.
- Selective strength: BTC has shown relatively more resilience compared to many altcoins, which reinforces BTC’s dominance in risk-off periods.
6. Recent Developments & Future Catalysts
- Some analysts are pointing to potential for renewed gains in October, historically a strong month for BTC.
- Institutional flows remain important: Bitcoin ETFs, treasury strategies, and corporate holdings continue to factor into strength.
- Regulatory clarity: In the U.S., recent policy moves like creating strategic crypto reserves and clearer stablecoin laws are adding to long-term positive sentiment.
Summary & Outlook
The recent price action among Bitcoin, Ethereum, XRP, and Solana reveals a market under stress but not without possible turning points. The large liquidations and failure to break above resistance levels suggest that bulls are being squeezed, especially in the altcoin space. For traders or investors seeking new opportunities, key support zones – ~US$107,000 for BTC; US$3,900-4,100 for ETH; ~$2.80‐3.00 for XRP; trendline around US$200-$220 for SOL – are critical. If those fail, risk could accelerate downward.
Conversely, breaking above resistance levels—BTC above ~$117,500; ETH above ~$4,700; XRP pushing back above its descending trendline; SOL recovering above ~$260—could reignite bullish trends, especially if backed by macro tailwinds like rate cuts, institutional demand, or favorable regulation.
For those hunting a new crypto or yield source, this is a moment to watch not just price charts but flow of capital (institutional), policy signals, and how leverage/unwinding plays out. A small misstep could cascade; but in volatility lies opportunity—as long as risk is managed.
