Main Points:
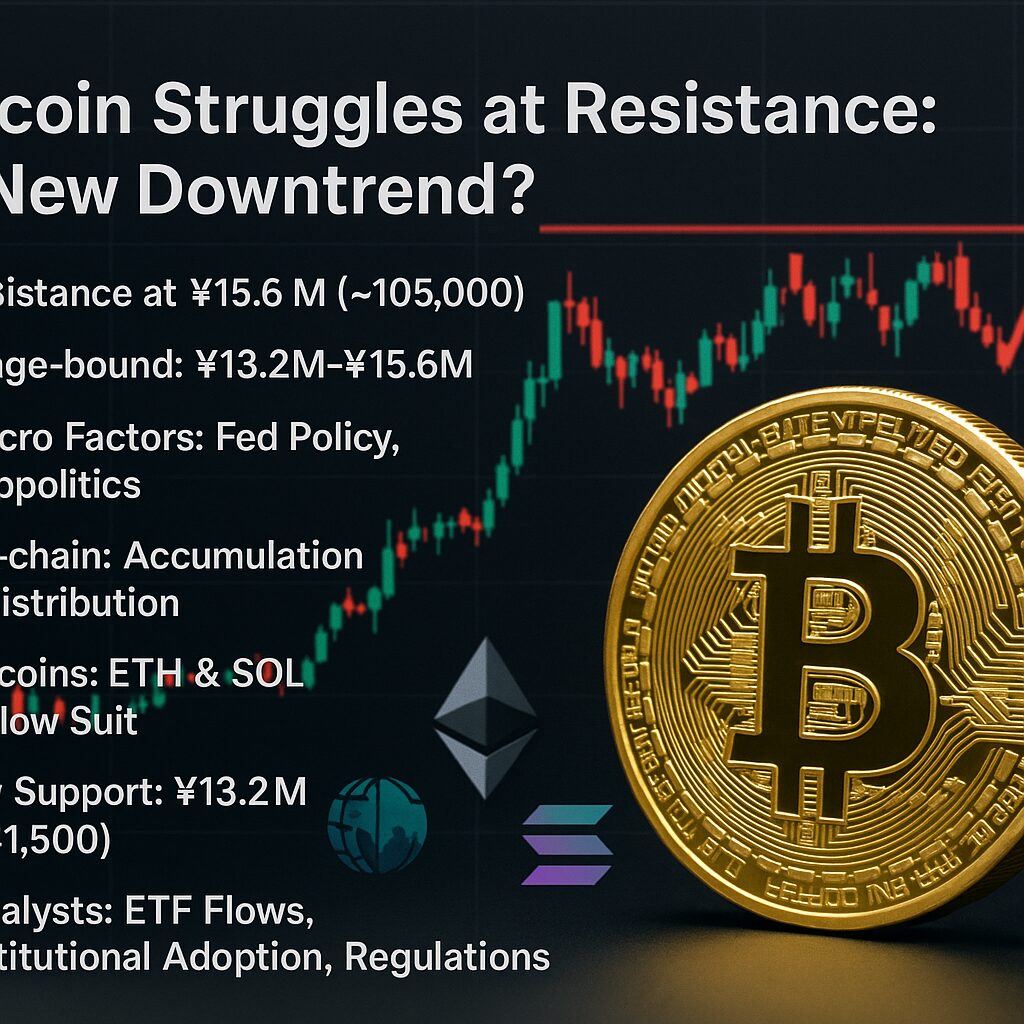
- Bitcoin faces significant resistance around ¥15.6 million ($105,000)
- Technical indicators suggest indecision within the ¥13.2 ($91,500) – ¥15.6 million ($105,000) range
- Macro factors—U.S. economic data, Fed policy, and geopolitical risks—loom large
- On-chain metrics show accumulation but distribution at highs
- Altcoins such as Ethereum (ETH) and Solana (SOL) are mirroring Bitcoin’s movements
- Outlook hinges on support at ¥15.2 million ($103,000) and ¥13.2 million ($91,500)
- Potential catalysts include ETF flows, institutional adoption, and regulatory developments
1. Market Overview: Price Action and Key Levels
Since the start of May, Bitcoin has oscillated near ¥15 million ($103,223), showing a choppy but overall sideways trend. Early in the month, BTC/JPY opened around ¥13.8 million (equivalent to roughly $100,000), dipped to a low of ¥13.25 million ($91,180) on May 6, and rallied to hit ¥15.59 million ($107,283) by May 11 before stalling. As of May 19, the pair was trading around ¥15.23 million ($103,000), reflecting market participants’ struggle to push through the stiff ceiling at approximately ¥15.6 million ($105,000).
Despite the mid-month peak, Bitcoin has yet to mount a decisive break above this resistance, suggesting profit-taking by traders at these levels. The narrow trading range of roughly ¥2.3 million ($15,828) between the May lows and highs underscores the market’s current indecision.
2. Technical Analysis: Support and Resistance
The ¥15.6 million mark acts as a key resistance level, reinforced by repeated rejections just under that figure. On the 4-hour chart, BTC/JPY has traced a rising support line connecting early-May lows, currently near ¥14.2 million ($96,000). As long as bulls defend the ¥15.15 million ($104,256) zone (around $103,000), the bullish structure remains intact.
However, a breach below the mid-range support—¥15.15 million ($104,256)—could accelerate selling toward the crucial ¥13.25 million ($91,180) floor (the May 6 low), which has served as a strong demand zone. Momentum indicators on TradingView show the Relative Strength Index (RSI) hovering near neutral, reflecting neither overbought nor oversold conditions, while Moving Average Convergence Divergence (MACD) on the daily chart has flattened, hinting at waning upward momentum.
3. Macro and Regulatory Factors
Beyond chart metrics, broader economic forces are influencing Bitcoin’s trajectory. U.S. consumer price index data and Federal Reserve communications this week are expected to sway risk appetite; stronger-than-expected inflation readings could trigger hawkish Fed commentary, dampening demand for equities and cryptocurrencies alike. Conversely, any indication of a shift toward looser policy would likely buoy risk assets, including BTC.
On the regulatory front, discussions in the U.S. Congress around potential approval of new spot Bitcoin ETFs have kept institutional investors on edge. Positive regulatory signals—such as Commissioner Hester Peirce’s recent supportive remarks—could unlock fresh inflows, while any pushback or delays might stoke uncertainty and weigh on prices. In Japan, the Financial Services Agency’s review of stablecoin guidelines adds another layer of oversight that market participants are watching closely.
4. On-Chain and Sentiment Indicators
On-chain data reveals a mixed picture. Glassnode reports a 15 percent rise in addresses holding more than 1 BTC over the past week, pointing to ongoing accumulation by both retail and institutional players. However, large-holder (whale) transfer volumes spiked around the May 11 peak, suggesting distribution at highs.
Meanwhile, the Crypto Fear & Greed Index remains elevated in “Greed” territory, currently around 70/100, hinting that overly bullish sentiment could leave the market vulnerable to sharp pullbacks if a negative catalyst emerges. Volatility, measured by the Bitcoin Volatility Index, has contracted relative to April, signifying a potential buildup before a breakout or breakdown.
5. Altcoin Correlations
Altcoins have largely mirrored Bitcoin’s choppy action. Ethereum (ETH) climbed to roughly ¥244,000 ($1,650) alongside BTC’s mid-month rally, only to retreat as selling pressure emerged at higher levels. Solana (SOL) and other Layer 1 tokens such as Avalanche (AVAX) and Sui (SUI) have similarly traded within tight ranges, their fortunes tied closely to Bitcoin’s strength or weakness.
Correlation analysis over the past fortnight shows BTC and ETH moving in lockstep, with a 0.88 correlation coefficient. Traders are now watching whether ETH can hold support near ¥225,000 ($1,520); a break there could herald broader altcoin weakness, while a rebound may signal renewed speculative interest beyond Bitcoin itself.
6. Outlook and Potential Scenarios
Bearish case: A failure to hold ¥15.15 million ($103,000) could see BTC/JPY slide toward the May low at ¥13.25 million ($91,500). In this scenario, increased volatility would likely spill into altcoins, prompting a wider market correction. Negative Fed commentary or disappointing ETF news could act as triggers.
Bullish case: If Bitcoin can decisively break above ¥15.6 million ($105,000) with strong volume, the next upside target becomes the psychological ¥16.5 million ($110,000) level. Sustained buying by institutions and approval of U.S. spot BTC ETFs would be powerful catalysts, potentially driving BTC toward ¥18 million ($120,000) by month-end.
Neutral case: Bitcoin may continue to trade sideways between ¥15.15 million ($104,256) and ¥15.6 million ($107,352) until a major macro or regulatory catalyst materializes. Range-bound conditions could persist, with traders alternating between buying dips and selling rallies.
Short-term traders should monitor key pivot points: ¥15.6 million ($107,352) (resistance), ¥15.15 million ($104,256) (support), and ¥13.25 million ($91,180) (critical floor). Longer-term investors will be focused on macroeconomic data and ETF developments, which are poised to shape Bitcoin’s next major trend.
7. Conclusion
Bitcoin’s recent behavior underscores a classic tug-of-war between bullish and bearish forces. While on-chain accumulation continues and ETF prospects offer hope for fresh capital, technical hurdles at the ¥15.6 million ($105,000) zone and macro uncertainties temper immediate upside expectations. Market participants should remain vigilant, watching both chart levels and broader economic signals. A break one way or the other could define the market’s trajectory for the weeks ahead: a decisive breach higher may spark a renewed bull leg, whereas a breakdown below key supports could lead to a deeper correction. Ultimately, adaptive risk management and attention to evolving catalysts will be paramount in navigating this critical juncture for Bitcoin.
